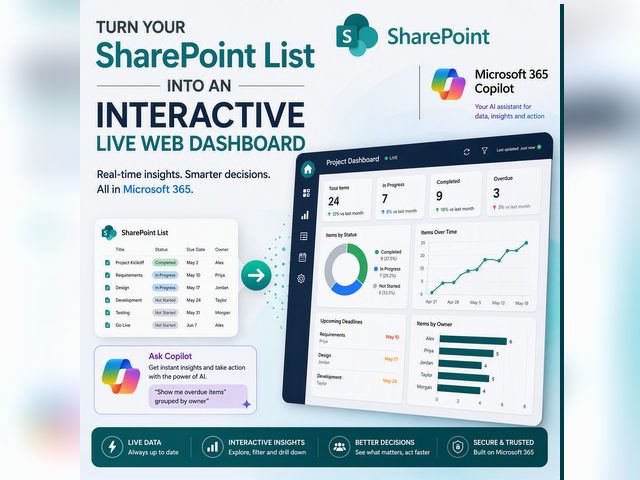

The capabilities across Microsoft 365 Copilot keeping improving on a weekly basis at the moment, and what is great to see is the continued investment in the core M365 Copilot experiences.
In this blog we will do a walk-though of how to create live, visually appealing and on-brand interactive dashboard data based on SharePoint lists. What is even better is you can use Copilot to do all the work and heavy lifting for you without writing a single line of code, HTML or python.
This is a step by step, so feel free to grab a beverage, sit back and follow along.
Before I get into this, I want to credit --> Zac Rosenfield <<- who is a Partner Director of Product Content at Microsoft, for his inspiration and various demos I have seen on how to do things like this.Step 1 – Create or Use a SharePoint List
To get started, you’ll need a SharePoint list (you might want to create one to follow along) that has data that you want to visualise and filter or present in a cool way.
To create a new SharePoint list, you’ll need to be in a SharePoint site you have admin or write access to. Head over the site and Create a New List

When you create a new SharePoint list, you can start with a blank list (and populate it later) or you import a list from a CSV, Excel file, existing SharePoint list, Microsoft form and various other sources.

For this example, I am going to import from an existing Excel spreadsheet.
Previously I had used Cowork to create me a truely interactive HTML file. It was really impressive, but the data/dates etc were embedded in the HTML file and it wasn’t therefore linking to any live data so meant I had to update the entire HTML each time I needed to update it – or manaually play around with the raw HTML code.
Anyway, since I already had a bunch of data I had crunched, I used Cowork to pull all the data for me again and populate into an Excel Spreadsheet. Cowork told me it cost 598 Copilot Credits to do this (about US $6) and it took around 15 mins to build a comprehensive list of tech, community and distribution events from now to end of 2027.

I uploaded the file from OneDrive to the SharePoint site

We click <NEXT> and then once its been processed (took a few seconds), we can help SharePoint understand the data we are feeding it. We can change/set column types, formatting, input validations (e.g., decimal places, date formats etc) as needed.

We click next and confirm the name and then SharePoint will create the list..

When the list is built we get a SharePoint List like below, we can of course tweak the headings, formats etc as needed.
Step 2 – Get Copilot to create dashboards
Ths is the fun part.
Once our list is created, we can use Copilot do make changes to our SharePoint list, create new visual views and other cool, stuff, but the really cool thing we can do is to use Copilot to create us an interactive webpage which can be used anywhere in our environment (Teams, Emailed, Chat, or of course, SharePoint). This will use the data from the SharePoint list we created, meaning if we update the content in the list, the dashboard is always up to date…
We are going to open Copilot Chat in SharePoint

The prompt I used is below, but you can make this your own as needed. Don’t worry if you do not get what you want first time as just any Copilot interaction, you can keep “vibe” working with Copilot until you are happy with the output.


Step 3 – A Live HTML Dashboard
So here we go – about 6 minutes later, I had the first version of the HTML dashboard.

I was really happy with this as a first pass. The file was saved as an HTML, I could open it directly, copy it somewhere else and open it and it all worked. It needs access / permissions to the list of course, but as it is a stand-alone file it is not fixed to that location.
Whilst I like it – I did need to make a few tweaks so back into Copilot Chat to tweak it. (forgive my bad spelling – Copilot did!).

Step 4 – My Finished Live Dashboard
You can keep asking Copilot to update the dashboard and make changes until you are happy with it. I made a couple more tweaks and added some filters etc.
Below is the version I’m happy with for now.

Step 5 – Create more dashboards
Of course, to update the dashboard, you can simply manually (or use the SharePoint agent) to update it. The next time the dashboard loads the data will be reflective of that list.
If you need to make changes to the HTML dashboard, I suggest you take a backup/copy of the file, then you can just ask Copilot to update it again or create you something new and different.
Here is an example of it as a Train Time Table – just for fun cos my kids love anything to do with trains…


Leave a Reply